|
|
|
|
|
||||||||||||||||||||||||
| FAQ | Finance glossary | Basic statistics | Monte Carlo simulation | Risk & CAPM | Lease or buy |
| Tutorial: RISK & CAPITAL ASSET PRICING MODEL |
||
|
Every financial investment contains some level of financial risk. This risk is usually expressed through the discount rate used in the financial analysis.
Since the risk varies from investment to investment, the discount rate needs to vary as well.
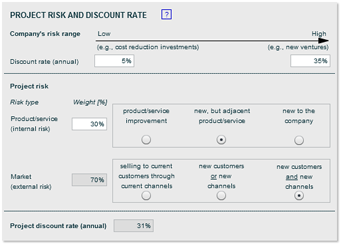
FinanceIsland's ROI analysis tool with Monte Carlo simulation enhances your typical net present value (NPV) analysis not only by embedding Monte Carlo simulation, but also by helping you to choose a project-specific discount rate. This project-specific discount rate allows for "apples-to-apples" comparison of independent investments competing for the same resources. The framework to calculate a project-specific discount rate is based on the Capital Asset Pricing Model. To simplify the use of this framework, FinanceIsland's ROI analysis provides a risk matrix to determine an appropriate project-specific discount rate. |
To see how the risk matrix (see below) described in this tutorial is used, please take a look at FinanceIsland's
ROI analysis tool.
|
|
|
Capital Asset Pricing Model (CAPM)
The financial risk is usually translated into a project-specific, risk-adjusted discount rate using the Capital Asset Pricing Model, a cornerstone of modern financial theory. Although this model has been developed by economists to help with investment decisions in the stock market, it is also used for investment analysis in the business world, including research & development (R&D) or marketing investments. CAPM defines the relationship between risk and return. The premise of the model is that the expected investment return varies in direct proportion to its risk, i.e., the riskier the investment - whether in the stock market or in R&D - the higher the return you should expect. CAPM calculates the risk-adjusted discount rate with the risk-free rate, the market risk premium, and beta: risk-adjusted rate = risk-free rate + market risk premium * beta As the name suggests, the risk-free rate is the discount rate for risk-free investments. In the United States, it's often approximated by the rate of short-term (3-month) Treasury bills, which can be found in major on- and offline news publications. Although Treasury bills are not completely risk-free, they are risk-less enough for CAPM's purposes. In the past ten years, the 3-month Treasury bills have varied in the U.S. between almost 0% and 6%.The market risk premium describes how much riskier the market as a whole is in comparison with a risk-free investment. In the U.S., this risk premium can be approximated through the average premium above the risk-free rate returned by the Standard & Poor's 500 index. For the purpose of calculating the risk-adjusted discount rate, the market risk premium has been historically in the 5% to 8% range. Both the risk-free rate and the market risk premium are usually project-independent. They vary, however, with the economy and can be substantially different from country to country. They often change when central banks change key interest rates. Beta (β), on the other hand, is investment-specific. It's a relative factor that measures how risky an individual investment is relative to the market. A beta of 1 means that an investment has exactly the same risk as the market. Businesses with relatively stable earnings tend to have lower betas than those with cyclical results or short lifecycle products. Betas for established companies usually range from 0.2 to 2, but they can go up to 5 and beyond for new ventures. Risk matrix If you know the beta of your project, you can use it with the risk-free rate and the market risk premium in the above formula to calculate your project's risk-adjusted discount rate. However, it's usually difficult to determine the appropriate beta for a project. FinanceIsland's ROI analysis tool solves this problem by using a risk matrix. FinanceIsland's risk matrix first captures company's risk range expressed through discount rates. This range represents the range of risk behind investments pursued by the company. It varies from low discount rates used for low risk investments such as cost reduction projects to high discount rates used for high risk investments such as new ventures. The matrix identifies then two risk components: internal and external. The internal risk component accounts for how familiar the company is with the products or services to be introduced. The external risk component addresses company's familiarity with the market they will be introduced to. The internal risk is usually more controllable by the company than the external risk. You can weigh these two risk drivers to account for different project exposures to internal vs. external risk. The matrix calculates then a project-specific and risk-adjusted discount rate based on these risk levels. The risk matrix helps also to standardize how the discount rates are derived. Most likely, you will be comparing and making trade-off decisions on several investment projects. Hence, it's crucial to calculate NPVs with discount rates that were derived based on the same approach. After the project's discount rate has been calculated, it's helpful to verify its correctness by comparing your project against other projects at your company to put its risk into perspective. Many times you will find that projects can be categorized according to their risks, as depicted in the following chart. You should expect cost reduction projects to be less risky than projects that introduce new products. Projects that develop new technologies or explore new ventures for your company should be the most risky. It's not uncommon for these high-risk projects to have discount rates of 30% to 40%. Low-risk projects on the other hand usually have discount rates in the range of 2% to 8%.
Weighted average cost of capital Larger companies with corporate finance teams should be aware of the cost of capital rate calculated by those teams. This cost of capital is the weighted average of the cost of equity and the cost of debt for the company and represents the minimum return expected for an average capital investment. Some of these corporate finance teams require that NPV calculations for ALL investment projects use the same weighted average cost of capital (WACC) rate as the discount rate. FinanceIsland strongly advises against using the WACC rate since it represents the average company risk. Risks of individual projects, however, may vary significantly from the average company risk, making WACC useless for individual project analysis. This is in particular true for investment projects that deviate significantly from typical projects undertaken by the company so far. Academic debate So, now that you've determined your project's risk-adjusted discount rate, you can use it to calculate and simulate your NPV. However, there is one potential issue to keep in mind. Some academics argue that the Monte Carlo simulation already takes into account NPV risk and hence cash flows should be discounted at the risk-free rate if the Monte Carlo simulation is used. Although we believe that there are pros and cons for this point of view, FinanceIsland recommends using the risk-adjusted discount rate when using Monte Carlo simulation. This approach is most consistent with typical scenario analyses where risk-adjusted discount rates are used. Nevertheless, the final call is yours. FinanceIsland's ROI analysis with Monte Carlo simulation gives you the option of ignoring the risk-adjusted discount rate and using other rate you deem appropriate. Whatever call you make, it's important to use the same approach for all financial analyses throughout your company. |
||