|
|
|
|
|
||||||||||||||||||||||||
| FAQ | Finance glossary | Basic statistics | Monte Carlo simulation | Risk & CAPM | Lease or buy |
| FINANCE
GLOSSARY |
||
|
A
B
C
D
E
F
G
H
I
J
K
L
M
N
O
P
Q
R
S
T
U
V
W
X
Y
Z
Accounts payable Amount owed to a creditor, usually a supplier,
arising from purchase of materials, supplies, or services, not
necessarily due or past due
Accounts receivable Amount owed by a debtor, usually a customer,
arising from sales or services provided, not necessarily due
or past due
Benefit-cost ratio see Profitability index
Beta Factor that measures how risky an individual
investment is relative to the market
A beta of 1 means that an investment has exactly the same risk as the market. You can find more information about beta in FinanceIsland's Risk & CAPM tutorial. Capital Asset Pricing Model (CAPM) Financial model that defines
the relationship between risk and return
The premise of the model is that the expected investment return varies in direct proportion to its risk, i.e., the riskier the investment – whether in the stock market, in research & development, or in capital investments – the higher return you should expect. You can find more information about the application of CAPM in business decisions in FinanceIsland's Risk & CAPM tutorial. Capital investments Purchases of long-lived assets,
usually high-ticket items, that are capitalized
instead of being expensed
According to accounting and tax regulations, long-lived business assets have to be capitalized and depreciated over time instead of being expensed. For example, a new $1M machinery equipment may be capitalized and depreciated over 10 years, resulting in a $100k annual depreciation over those 10 years, assuming that the straight-line depreciation method is used. Cash flow Cash receipts from customers,
investors, or other sources (cash inflows), and
cash disbursements to suppliers, employees, investors,
or other sources (cash outflows)
Confidence interval
Range between confidence limits, which reflects how confident you can be that a metric calculated based on your data set will lie within these limits
(see also FinanceIsland's basic statistics tutorial)
Contribution margin Analysis-specific measure of the profit contribution
Unlike standard financial metrics such as gross margin (= net revenues - cost of sales) and operating profit (= gross margin - operating expenses), contribution margin is a somewhat vague metric whose definition varies from analysis to analysis. Hence, it's important to understand the definition of contribution margin used by the analyst before making any meaningful decisions. The benefit of contribution margin is, however, that it can focus on the relevant variable drivers impacting the analysis results. For example, in a optimal supply analysis the contribution margin may be defined as gross margin minus disposal cost. Since only gross margin and disposal cost are the variable components of the supply options, it is sufficient to analyze only this contribution margin without the need for analyzing operating profit. Days payables outstanding (DPO) Number of days between the
time a purchase is booked in the accounting systems
and the time the supplier is paid for that purchase
Although DPO may vary from purchase to purchase and from supplier to supplier, an average company DPO is often used in financial models. Financial models, including FinanceIsland's tools, assume also that the supplier bills the company at the beginning of the time period. Usually, DPO varies between 30 and 90 days but for some industries and companies it may be outside of this range. Days sales outstanding (DSO) Number of days between the
time a sale is recorded in the accounting systems
and the time the company receives cash for that
sale
Although DSO may vary from customer to customer, an average company DSO is often used in financial models. Financial models, including FinanceIsland's tools, assume also that the customer is billed at the beginning of the time period. Usually, DSO varies between 30 and 90 days but for some industries and companies it may be outside of this range. Depreciation Allocation of the cost of
an asset over its useful life
For accounting and tax purposes, long-lived business assets need to be capitalized or amortized instead of being expensed. Depreciation is amortization of plant assets such as equipment, machinery, or physical structures. Depreciation allocates the cost of a capital investment over its depreciation period. There are several depreciation methods including straight-line depreciation and accelerated depreciation. In the case of the straight-line depreciation for example, a $1M machinery equipment can be depreciated over its 10-year life resulting in an annual depreciation of $100k over those 10 years. Depreciation period Time frame, usually number
of years, during which capital investments are
depreciated
Discount rate Rate of return to calculate
the present value of future cash flows
The discount rate, also referred to as rate of return, hurdle rate, or opportunity cost of capital, is a proxy for the financial risk associated with any investment. This opportunity cost is the return forgone by investing in a specific project rather than in comparable investment alternatives. The discount rate is determined based on the first basic principle of finance that a dollar today is worth more than a dollar tomorrow and based on the second basic finance principle that a safe dollar is worth more than a risky dollar. Since the discount rate needs to be determined based on the risk of the investment, a financial model such as the Capital Asset Pricing Model (CAPM) can be used for that purpose. You can find more information about choosing an appropriate discount rate for various investment projects in FinanceIsland's Risk & CAPM tutorial. Discounted cash flows Present values of future cash
flows, whether in- or outflows
Discounted payback period Expanded version of the payback period
The payback period represents the number of periods it takes until the cumulative cash flow becomes positive. Since this rule doesn't take the time value of money into account, a slightly better version of this metric is the discounted payback period, which is based on cumulative discounted cash flows. Investment projects are accepted if the payback period meets some predefined cutoff period. Since this cutoff period is chosen arbitrarily, the payback period is a subjective measure. It simply ignores any cash flows after the cutoff. You can find more information about the payback period and other financial metrics in this post on FinanceIsland's blog. Discounted profitability index (DPI) Expanded version of the profitability
index (PI)
The profitability index (also referred to as the benefit-cost ratio) is the present value of future cash flows divided by the initial investment. DPI is an expanded version of the profitability index and discounts also the initial investment, which may not always be incurred in the first period of the project. Usually, an investment project should be accepted if DPI is greater than 1. Disposal cost
Cost associated with disposing products that were produced or ordered but cannot be sold to customers or returned to suppliers
Effective tax rate Company's tax rate
based on the federal tax rate and potentially
adjusted for state or local taxes
Interest rate Interest rate charged by a
financial institution for a lease or loan
Internal rate of return (IRR) Discount rate at which NPV
is zero
Although IRR is widely used in finance, it has several drawbacks. These drawbacks include potentially multiple IRRs and the inability to rank projects with different patterns of cash flow. In an ideal case though, you should accept any investment project offering an IRR above the opportunity cost of capital. You can find more information about IRR and other financial metrics in this post on FinanceIsland's blog. Inventory Raw materials, supplies, work
in process, and finished goods
Inventory turns per year Number of times the average
inventory is sold during a year
Although inventory turns may vary from product to product, usually company's average inventory turns are used in financial models. Financial models, including FinanceIsland's tools, assume also that goods become part of inventory at the beginning of the time period before being shipped to customers. Inventory turns are calculated as the annual cost of sales divided by the average inventory for the same year. Lost contribution margin Contribution margin that cannot be achieved due to limited supply (see also Contribution margin)
Lost revenues Revenues that cannot be achieved due to limited supply (also referred to as opportunity costs)
Market risk premium Component of the Capital Asset
Pricing Model (CAPM) that describes how much
more risky the market as a whole is in comparison
with a risk-free investment (see also FinanceIsland's Risk & CAPM
tutorial)
Mean
Sum of all data points divided by the number of data points, also known as average (see also FinanceIsland's
basic statistics tutorial)
Mode
Most common value in a data set (see also FinanceIsland's basic statistics tutorial)
Money factor Another representation of
the interest rate in a lease
The money factor may be used by leasing companies to simplify the calculation of the monthly lease financing fee. The money factor equals annual interest rate times 100 divided by 2400. For more details, please see definition of the monthly lease financing fee. Monte Carlo simulation Sophisticated scenario analysis
Monte Carlo simulation allows to investigate thousands of scenarios in a short period of time. These scenarios are defined through a probability distribution and its simulation parameters. You can find more information about Monte Carlo simulation in FinanceIsland's Monte Carlo simulation tutorial. Monthly depreciation fee Part of the monthly lease
payment that covers the depreciation of the equipment
The monthly lease payment consists of two components: depreciation fee and lease financing fee. The depreciation fee covers the loss of value of the equipment during the lease duration. The monthly depreciation fee is calculated as: 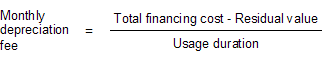 Monthly lease financing fee Part of the monthly lease
payment that covers finance charges
The monthly lease payment consists of two components: depreciation fee and lease financing fee. The lease financing fee is the finance charge to pay the leasing company for the use of its money. It corresponds to the interest payment in a loan. The monthly lease financing fee can be approximated based on the average amount to be financed and based on the monthly interest rate as described in the formula below. The leasing company may simplify the calculation by using the money factor. 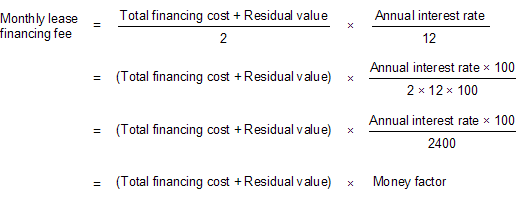 Monthly loan payment Monthly payments for the loan
Net present value (NPV) Sum of discounted cash flows
Discounted cash flows are present values of cash flows, whether in- or outflows. When comparing different investment options with varying levels of cash flows in varying time periods, NPV calculated with the appropriate discount rate is the best measure to compare these options. Usually, an investment project where positive numbers represent cash inflows should be accepted if NPV is greater than zero. In cases where NPV is used to compare total costs where positive numbers represent cash outflows, like in FinanceIsland's lease-or-buy calculator for example, an investment with the lowest NPV should be selected. You can find more information about NPV and other financial metrics in this post on FinanceIsland's blog. Opportunity cost of capital see Discount rate
Payback period Number of periods it takes until the cumulative cash flow becomes positive
Investment projects are accepted if the payback period meets some predefined cutoff period. Since this cutoff period is chosen arbitrarily, the payback period is a subjective measure. It simply ignores any cash flows after the cutoff. It also doesn't take the time value of money into account. You can find more information about the payback period and other financial metrics in this post on FinanceIsland's blog. Present value Discounted value of future cash flows
Present value is calculated based on a discount rate that takes into account that a dollar today is worth more than a dollar tomorrow and that a safe dollar is worth more than a risky dollar. You can find more information about time value of money and safe dollar on FinanceIsland's blog. Probability distribution Describes how likely it is that a measure will take on a particular value
A probability distribution is an input into Monte Carlo simulation. There are dozens of probability distributions in statistics, but there are only few that are relevant for business. You can find more information about probability distributions in FinanceIsland's Monte Carlo simulation tutorial. Profitability index (PI) Present value of future cash flows divided by the initial investment
The profitability index (also referred to as the benefit-cost ratio) can also be calculated as NPV divided by the initial investment plus one. Usually, an investment project should be accepted if PI is greater than 1. You can find more information about the profitability index and other financial metrics in this post on FinanceIsland's blog. Risk-free (discount) rate Component of the Capital Asset
Pricing Model (CAPM) that represents the discount
rate for risk-free investments (see also FinanceIsland's Risk & CAPM
tutorial)
Sensitivity chart Displays how sensitive a metric is to its drivers
The sensitivity chart is created by changing the value of each driver by a specified percentage amount while keeping all other drivers at their original values. The chart is usually displayed as a horizontal bar chart where the bars represent a range of possible metric values for each driver. The drivers with the widest bars have the biggest impact on the metric and should be analyzed in more detail. With the different width of the bars, the chart often resembles a tornado, hence it is also referred to as tornado chart. Standard deviation
Metric for measuring the spread in a data set (see also FinanceIsland's
basic statistics tutorial)
Tornado chart see Sensitivity chart
Total monthly lease payment Sum of the monthly depreciation
fee and the monthly lease financing fee
|
||